The Executive Dashboard provides a comprehensive overview of replenishment metrics, product performance, and user notifications to help you make data-driven decisions. This guide explains the purpose of each section and how you can utilize the information to optimize your replenishment strategies.
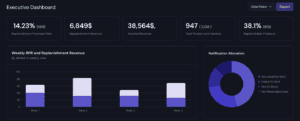
Main Metrics Overview #
Replenishment Purchase Rate #
Description: Displays the percentage of users who completed a replenishment purchase.
Usage: Monitor this metric to assess the effectiveness of your replenishment campaigns. Aim to increase this rate by optimizing communication and product recommendations.
Replenishment Revenue #
Description: Shows the total revenue generated from replenishment purchases.
Usage: Use this metric to track the direct financial impact of your replenishment program.
Assisted Revenue #
Description: Indicates revenue indirectly influenced by the replenishment reminders.
Usage: Understand the broader impact of replenishment efforts on customer purchasing behavior.
Total Products and Variants #
Description: The total number of products and their variants in your catalog.
Usage: Ensure your product catalog is updated to maximize replenishment opportunities.
Replenishable Products #
Description: The percentage and count of products considered replenishable.
Usage: Identify and expand your catalog’s replenishable products to improve engagement.

Graphs and Analytics #
Weekly RPR and Replenishment Revenue #
Description: A bar chart showing weekly repeat purchase rate (RPR) and revenue trends.
Usage: Monitor weekly performance to identify patterns or anomalies. Adjust marketing efforts accordingly.
Notification Allocation Pie Chart #
Description: Visualizes the allocation of notifications across statuses:
- Successfully Sent
- Failed to Send
- Not In Stock
- Not Reachable User
Usage: Analyze the distribution to address issues like stock availability or unreachable users.

Performance Insights #
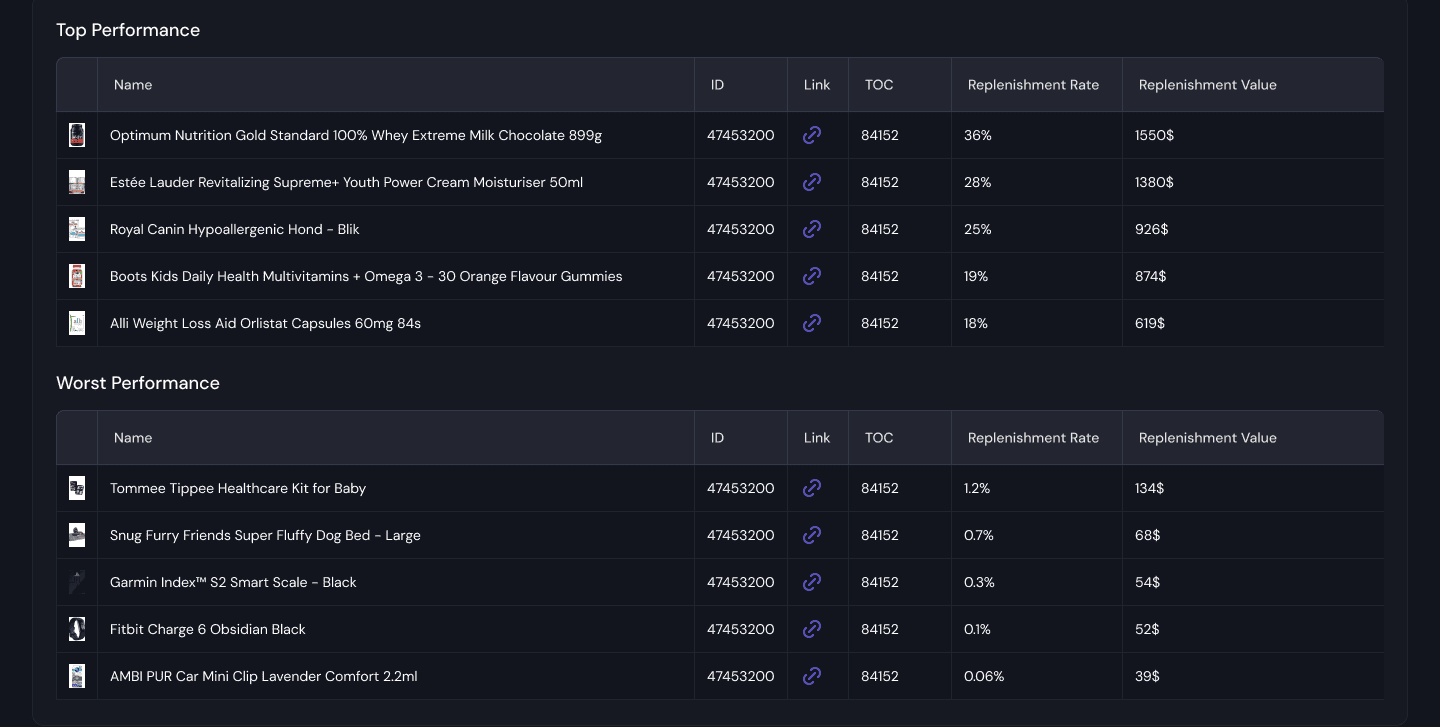
Top Performance Table #
Description: Highlights the top-performing products based on replenishment rate and value.
Columns:
- Name: Product name.
- ID: Unique product identifier.
- Link: Direct link to the product page.
- TOC: Total Order Count.
- Replenishment Rate: Percentage of repeat purchases.
- Replenishment Value: Revenue generated from replenishments.
Usage: Identify successful products and replicate their strategies for other items.
Worst Performance Table #
Description: Lists products with the lowest replenishment rates and values.
Usage: Investigate and improve low-performing products by analyzing stock levels, pricing, or communication strategies.
Upcoming Reminders Sneak Peek #
Upcoming Notification Counts #
Description: Provides a preview of reminders scheduled to be sent.
Unique User and Product Counts #
Description:
- Unique Users: Total number of individual users to be reminded.
- Unique Products: Total number of distinct products included in the upcoming reminders.
Not Reachable Users Pie Chart #
Description: Displays the proportion of reachable vs. non-reachable users.
Usage: Reduce the “Not Reachable” count by effective lead collection strategies.
Not In Stock Products Pie Chart #
Description: Shows the split between in-stock and out-of-stock products.
Usage: Minimize lost opportunities by ensuring adequate stock levels for replenishment.
How to Use the Dashboard #
- Set the Date Range: Use the date picker to analyze data for a specific period.
- Export Data: Download reports in a preferred format for further analysis or sharing.
- Monitor Metrics: Regularly review the main metrics to gauge overall performance.
- Optimize Notifications:
- Address “Failed to Send” and “Not Reachable” issues promptly.
- Ensure key products are in stock.
- Leverage Performance Insights: Focus on improving underperforming products and replicating successful strategies.
- Track Trends: Use graphs to identify weekly changes and take corrective actions when needed.